Managing faults and services in OpenSolaris
Introduction
In this chapter we will cover fault and services administration and management. The fault management mostly deals with failing hardware components while service management and administration deals with software failures. A hardware failure is a faulty RAM module and a sample of failing service component is an HTTP server stopped functioning properly.
OpenSolaris is an enterprise operating system meaning that it should be resilient to both software and hardware failures and automatically recover from the failure and repair itself or in cases when it is not possible for the OS to repair and recover, it should notify some administrator to take action. OpenSolaris goes further and provides the administrators with relevant knowledge and diagnosis for the failure using the unified infrastructure for fault management which includes the following features.
Both faults and service management is built on top of a unified fault management model capable of reconfiguring the faulty hardware and restarting a failing service. The framework connects administrators to the unified knowledge repository which contains information about the error, what could have caused the error and how the administrator can treat the problem.
The fault management service is called Fault Management Daemon (FMD) and we may use SMF for the Service Management Framework which provides us with the required tools and infrastructure to manage the software services.
The knowledge repository is accessible through the web interface by navigating to http://www.sun.com/msg/ address. Each entry in the knowledge repository is uniquely identified by its URI and the fault and service management framework is aware about all of these identifiers and how each one of them is associated with a fault in the hardware components or software services.
1. Administrating faults using fmadm command
In this recipe we will study how we can use the fmadm command to get the list of faulty components along with the detailed information about the fault.
Getting ready
Before starting this recipe we should have a command console open and then we can proceed with using the fmadm command.
How to do it…
The most basic form of using fmadm command is using its faulty subcommand as follow
|
|
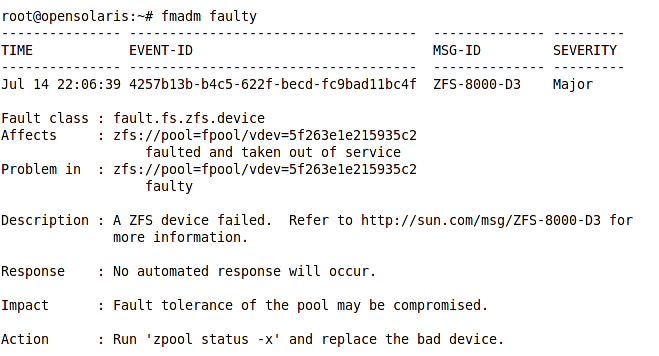
Starting from top we have
-
Identification record: This record consisting of the timestamp, a unique event ID, a message Id letting us know which knowledge repository article we can refer to for learning more about the problem and troubleshooting and finally the fault severity which can be Minor or Major.
-
Fault Class: This field allows us to know what is the device hierarchy causing this fault
-
Affects: tells us which component of our system is affected and how. In this instance some devices are missing and therefore the fault manager takes the Zpool out of service.
-
Problem in: shows more details about the problem root. In this case the device id.
-
Description: this field refer us to the a knowledge base article discussing this type of faults
-
Response: Shows what action(s) were executed by fault manager to repair the problem.
-
Impact: describe the effect of the fault on the overall system stability and the component itself
-
Action: a quick tip on the next step administrator should follow to shoot the problem. This step is fully described in the knowledge base article we were referred in the description field.
Following figure shows the output for proceeding with the suggested action.
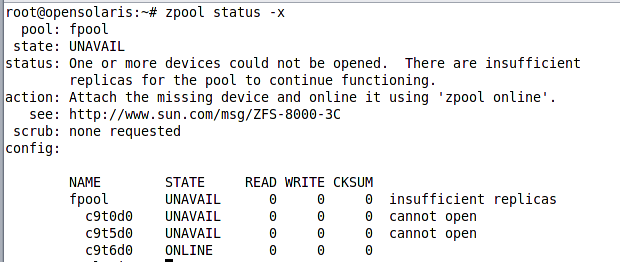
As we can see the same article we were referred to, is mentioned here again. We can see that two of the three devices have failed and fpool had no replica for each of those failed device to replace them automatically.
If we had a mirrored pool and one of the three devices were out of service, the system could automatically take corrective actions and replace continue working in a degraded status until we replace the faulty device.
How it works…
The fault management framework is a plug-able framework consisting of diagnosis engines and subsystem agents. Agents and diagnosis engine contains the logic for assessing the problem, performing corrective actions if possible and filing the relevant fault record into the fault database.
To see a list of agents and engines plugged into the fault management framework we can use config subcommand of the fmadm command. Following figure shows the output for this command.
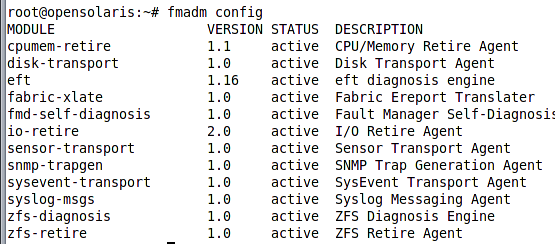
As we can see in the figure, there are two engines deployed with OpenSolaris, eft and the zfs-diagnosis. The eft, standing for Eversholt Fault Diagnosis Language, is responsible for assessing and analyzing hardware faults while the zfs-diagnosis is a ZFS specific engine which analyzes and diagnoses ZFS problems.
There’s more…
The fmadm is a powerful utility we which can perform much more than what we discussed. Here we can see few other tasks we can perform using the fmadm.
Notifying the Fault Manager about a repair or replacement
We can use the repaired subcommand of the fmadm utility to notify the FMD about a fault being repaired so it changes the component status and allows it to get enabled and utilized.
For example to notify the FMD about repairing the missing underlying device of the ZFS pool we can use the following command.
|
|
Administrating Fault Manager Log files
We can rotate the log files created by the FMD when we want to keep a log file in a specific status or when we want to have a fresh log using the rotate subcommand as shown below.
|
|
See also
To learn more about fmadm command we can use the man pages and the short help provided with the distribution. Following commands shows how we can invoke the man pages and the short help message.
|
|
A good starting resource is the FM wiki page which is located at http://wikis.sun.com/display/OpenSolarisInfo/Fault+Management
2. Using fmstat to view fault management modules statistics
In this recipe we will see how we can see statistics about faults in our operating system and its underlying hardware using the fmstat command.
Getting ready
We will use fmstat which is a console command therefore we will need to be in the console window or a virtual terminal to use the command. To open a terminal hit ALT+F2 and type gnome-terminal.
How to do it…
Invoking fmstat without any parameter will show all statistics for all modules briefly like the following figure.

There are several columns in the output, following list summarize important columns.
The ev_recv indicates the number of event received for this module
The ev_acpt indicates the number of events accepted for this module
The svc_t indicates the time spent for servicing the events
The above command only shows overall statistics for the each module and does not provide what were the faults for each module. To see the detailed statistics for each module we can use the following syntax of fmstat command.
|
|
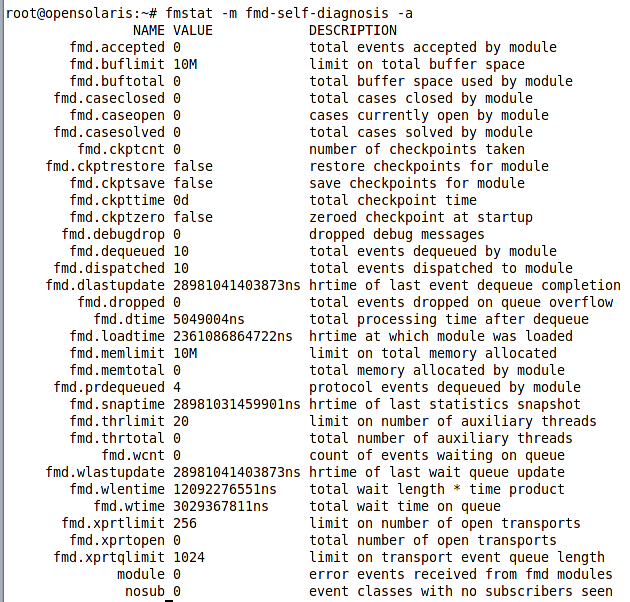
The fmstat command can do more than showing one time snapshot of the errors, it can collect and display statist continually which we can use it in our scripts or task automation. We can use following syntax to view the stats in time based interval.
fmstat interval count
For example to see the zfs-diagnosis module stats we 10 times with 5 seconds interval we can use the following command
|
|
How it works…
The fault management system stores all of its messages in the /var/fmd/errlog and /var/fm/fltlog and when we invoke a fault management command the command looks for the relevant records in this file, cross reference them with the fault management database to connect the fault with knowledge base URLs and descriptions if required and then show the result.
See also
We can use the man pages for fmstat or its short help for more information about the command.
|
|
3. Using fmdump to analyze the fault management logs
The fmdump command is the command we will use when we need to see further details compared to what the fmadm can gives us. Basically fmdump gives us a more direct and low level access to the error logs content rather than formatting and filtering before displaying the messages.
Getting ready
We should fire up a console or a virtual terminal before using this command as it is a CLI command.
How to do it…
The command is very flexible and relatively simple to use. The most basic use of the command is using it with no parameter which will show a list of one line records each associated with a fault similar to the following figure.

The column starts with the fault timestamp, the fault unique ID and the message id which we can use to find knowledge base article related to this type of fault in the sun fault management knowledgebase.
For example we can use the http://sun.com/msg/ZFS-8000-D3 to see what the reason for the second fault is and what we can do to fix the problem.
The fmdump command provides us with a fair level of flexibility in using it. Following table shows what are its important parameters and use cases.
| Parameter | Description, Sample use |
|---|---|
| -u <fault ID> | Select the fault identified with the given uuid # fmdump -u 252601b6-98e6-4b5d-e216-cb42d1f028f0 |
| -v | Shows the selected fault brief information # fmdump -v -u 252601b6-98e6-4b5d-e216-cb42d1f028f0 |
| -V | Shows detailed information about the selected fault # fmdump -V -u 252601b6-98e6-4b5d-e216-cb42d1f028f0 |
| -c | Select a class of faults for fmdump to operate on |
| -e | Shows errors listed stored in the fault management logs [for the selected fault class] # fmdump -e -c ereport.fs.zfs.zpool |
| -t and -T | Select events occurred after the selected time or before the specified time. # fmdump -t 20:50 -V -e -c ereport.fs.zfs.zpool |
Let’s see what is output for one the commands we discussed above. Assuming that we want to see brief information about 252601b6-98e6-4b5d-e216-cb42d1f028f0 we can use the following command:
|
|

We can combine the parameters in any way we want, they just apply filters over the log entries before displaying them like -t and -T or include the detailed information about the event like -V or -v.
How it works…
This utility acts as an interface between administrator and raw log files. The command basically reads the log files and sort, filter; show its content in a readable way for administrators.
There’s more…
To learn more about the fmdump command we can review its man pages or the short help.
|
|
See also
Recipe 1 and recipe 2 of this chapter can be helpful for understanding the overall fault management in OpenSolaris.
4. Checking fault management support for the system components
We cannot expect all of our hardware components and software services to be supported by the fault management framework because basically different components shows different symptoms when they are failing and not all of them are known to the fault management system.
Getting ready
We can use the fmtopo CLI utility to check which system components are supported by fault management and which components are not. To start we need to fire a console or switch to a virtual terminal.
How to do it…
Invoking the fmtopo command with no parameter will show all of the fault management supported resources while we can filter the result using the wildcard characters. Following figure shows a part of the output we might get when invoking the fmtopo -p command. Let’s see what does each of the abbreviation means.

The hc stands for Hardware Component and specifies a resource that can detect an error
Th ASRU stands for Automated System Recovery Unit and specifies any resource that must be disabled in the system to prevent a fault it is causing.
The FRU stands for Field Replaceable Unit and specifies the resource which should be replaced to repair a fault.
The Label string specifies the location of the resource. For example MB or SLOT #.
For example to see anything related to motherboard in the supported list we can use the following command.
|
|
|
|

How it works…
The fmtopo command checks the available resources in the system and cross reference the list of these resources with the list of know and supported resources and finally print the result.
See also
You can learn more about the fmtopo and its usage by referring to its man pages or the online reference guide located at http://docs.sun.com/app/docs/doc/819-3196/gemgw?a=view
5. Authoring SMF service manifest
SMF services are basically daemons staying in background and waiting for the requests which they should server, when the request come the daemon wake ups, serve the request and then wait for the next request to come.
The services are building using software development platforms and languages but they have one common aspect which we are going to discuss here. The service manifests which describe the service for the SMF and let the SMF manage and understand the service life cycle.
Getting ready
To write a service manifest we should be familiar with XML and the service manifest schema located at /usr/share/lib/xml/dtd/service_bundle.dtd.1. This file specifies what elements can be used for describing a service for the SMF.
Next thing we need is a text editor and preferable an XML aware text editor. The Gnome gedit can do the task for us.
How to do it…
The service manifest file composed of 6 important elements which are listed below.
The service declaration: specifies the service name, type and instantiation model
Zero or more dependency declaration elements: Specifies the service dependencies
Lifecycle methods: Specifies the start, stop and refresh methods
Property groups: Which property groups the service description has.
Stability element: how stable the service interface is considering version changes
Template element: more human readable information for the service.
To describe a service, first thing we need to do is identifying the service itself. Following snippet shows how we can declare a service named jws.
|
|
All of the elements which we are going to mention in the following sections of this recipe are immediate child elements of the service element which itself is a child element of the service_bundle element.
The next important element is dependency declaration element. We can have one or more of this element in our service manifest.
|
|
The require_all which represent that all services marked with this grouping must be online before our service came online
The require_any which represents that any of the services in this grouping suffice and our service can become online if one of them is online
The optional_all presence of the services marked with this grouping is optional for our service. Our service works with or without them.
The exclude_all: specifies the services which may have conflict with our service and we cannot become online in presence of them
The next important elements are specifying how the SMF should start, stop and refresh the service. For these tasks we use three exec_method elements as follow:
|
|
|
|
|
|
The start and stop methods description are required to be present in the manifest in order to import it into the SMF repository but the refresh method description and implementation is optional.
The timeout_seconds=‘60’ specifies that the SMF should wait for 60 seconds before aborting the method execution and retrying it over. We can use longer timeout when we know that the execution of the method take longer or lower timeout when we know that our service starts sooner.
The property group elements specify which property groups the SMF should associate with the service. We can use as many of the SMF built-in property groups or define our own property groups. We will discuss more about custom property groups in recipe 8.
|
|
Next important element is the stability element which specifies whether the property names, service name, its dependencies and other service attributes may or may not change for the next release. For example the following snippet specifies that the service attributes may change in the next release.
|
|
|
|
All of these elements should be saved into an XML file with the following structure:
|
|
The service_bundle, service, and start and stop method elements are mandatory while other elements are optional.
Now we should install the service into the SMF repository and then administrate it. For installing the service we can use the following command.
|
|
How it works…
When we import the service manifest into the service repository, SMF will scan the service profiles and check whether this service is required to be enabled either directly or because of a dependent service or not. If required, the SMF will use the start method specified in the manifest to start the service. But before starting it, SMF will check its dependencies and start any required service recursively if they are not already online.
See also
Reviewing the XML schema located at /usr/share/lib/xml/dtd/service_bundle.dtd.1 and the next three recipes is recommended for grasping a better understanding of this recipe.
6. Listing Services and viewing Service details
OpenSolaris service management framework or simple SMF is an extendible and customizable framework for managing software services. The management includes definition, dependency management, starting, stopping and watching the services for fail over recovery. In this recipe we will study how we can use svcs command to see list of the installed services and how to check the service health and diagnose its problems.
Getting ready
The svcs is a CLI utility so we should either open a console or switch to a virtual terminal.
How to do it…
The svcadm command has three primary functions listed below.
Listing all services, either online, offline, enabled, disabled or faulty
Showing a service detailed information
Displaying service dependencies.
The first use case is possible by simply invoking the svcs command, it will show all services which are in normal stat. Normal state means services which are enabled either online or offline.
To see a list of services which are installed either disabled or enabled we can use the -a parameter when invoking the command.
To see a list of all faulty services we can use the -x parameter when invoking the svcs command.

In my case the DHCP service is faulty and the status message shows me some details about the problem along with the link of the knowledge base article that I can review to resolve the problem.
In all of the above use cases we can add -pHv to see mode details about the listed services.
Next important function of svcadm is checking status of a service. To see a service details or brief status record we can use one of the following svcs command’s syntaxes.
|
|
The Fault Managed Resource Identifier (FMRI) format, for example svc:/network/smtp:sendmail
The abbreviation format, for example network/smtp:sendmail
The name matching patterns like network/*mail, network/smtp, smtp:sendmail, smtp or sendmail.
Following figure shows how we can check the detailed status of our FTP service using the scvs command.
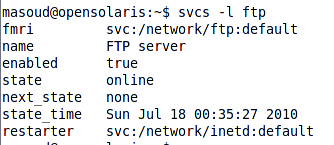
All the details we can see are self explanatory except for the restarter which we will discuss in recipe 5 of this chapter.
The pattern matching syntax of passing service name argument to svcs is very useful when we want to check status of several services with matching FMRIs. For example to see detailed status of all XVM services we can use the following command.
|
|
|
|
|
|

The list shows which services the smtp service depends on to function properly and what is status of those services.
How it works…
Majority of the svcs utility tasks involves manipulating the service repository and service manifests which we discussed in recipe 5 and will discuss further in recipe 8 and 9.
Getting list of process a service depends on
To see the list of processes which a service depends on, we can use the -l -p parameters. For example to see detailed list of process which smtp service depends on them for functioning properly we can use the following command.
|
|
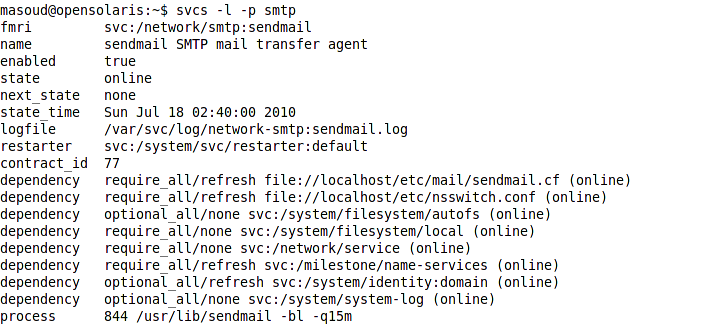
We can see some similarities between the list of services the SMTP service depends of and the list of process. In the list of process we have an additional column letting us know whether the dependency is optional or not. This fall useful when we need to kill some process or services but we need to ensure that the service is not required for any other services to function properly.
For example to check whether any of the network services is depending on the autofs service we can use a command similar to the following one.
|
|

See also
To learn more about SMF and services review recipe 5 of this chapter which discuss how to create a service manifest and basically install a service into OpenSolaris SMF.
7. Administrating services using svcadm utility
In this recipe we learn how to use the svcadm, which is one of the four common commands for dealing with services, to administrate the services.
Getting ready
The svcadm is a CLI utility so we should either be in a virtual terminal or fire a console to run it.
How to do it…
The svcadm utility has a set of subcommands which we use them to perform different administrative tasks. The command syntax is similar to the following schema:
svcadm -v subcommand [parameters] <service name(s)>
When we use the -v before a subcommand svcadm displays a verbose output of what it is doing. Following table shows the list of subcommands and their options
| -r | -s | -t | -I | |
|---|---|---|---|---|
| enable | * | * | * | |
| disable | * | * | ||
| mark | * | * |
The -r option specifies that all services required for the operand service will be enabled recursively
The -s option specifies synchronous execution of commands which can be enabling services or disabling them
The -t option specifies that the command should affect the service temporarily until the next restart.
The -I option specifies that the operation must take place immediately.
The following list shows major tasks we can perform using the svcadm subcommands.
Restarting and Refreshing a service
Enabling and disabling a service
Setting and clearing the maintenance stat
For each of the tasks named in the above list we have a subcommand in svcadm to use. For example let’s study the first task.
|
|
We can use any of the service name schemas discussed in the previous recipe except for the wildcard name matching which can result in tens of services get restarted. When we need to operate on more than one service we can simply pass all the service names to the command. For example to restart ssh and smtp services we can use
|
|
|
|
When we enable a service using the above syntax it does not guarantee that the service will work properly because it might depends on other services which are not enabled. To enable a service and all services which it depends on we can use the -r option. For example the following command enables the ssh service and all services which it depends on them for proper functioning.
|
|
|
|
|
|
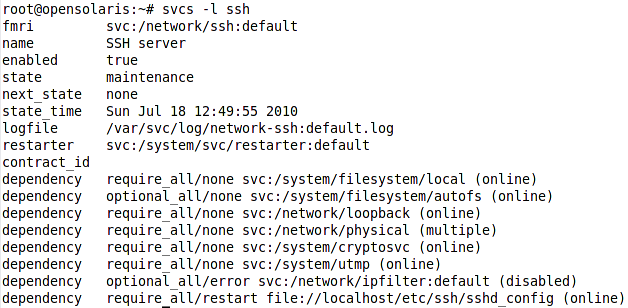
To clear the ssh service state from maintenance or degraded we can use the clear subcommand as follow.
|
|
How it works…
The svcs command uses the service manifest file and the SMF repository to execute our administrative commands. For example when we disable a service, the service state changes to disabled in the repository and when we restart a service the start method of the service manifest file is invoked to perform all the necessary steps to start the service.
See also
It will be good to review recipe 5 in which we discussed service manifest file and recipe 8 and 9 which discusses the service repository to grasp a better understanding of this recipe.
Reviewing the man pages and short help message is another good point to get better understanding of the subcommands and options.
|
|
8. Configuring services
We can configure a service by adjusting the parameters which affect the way that SMF interact with the service like changing timeouts, dependencies, and name and so on by accessing the SMF repository data. The utility command for configuring services is named svccfg.
Getting ready
The svccfg is a console utility and we should use it in a console or virtual terminal.
How to do it…
The svccfg operates both in interactive mode and also in headless or script mode to be used in administration scripts. Working with svccfg in command line mode involves specifying all of the options prior to invoking the command. For example to view list of the smtp service properties we can use the following command.
|
|
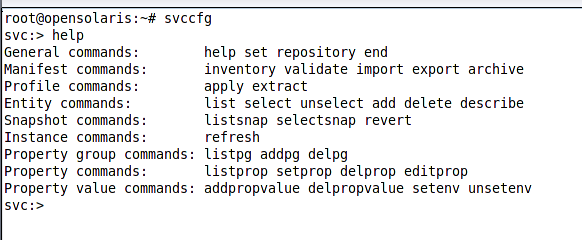
The help commands shows a two column message, The first column shows the commands category and the second column list of commands fitting into that category. We will discuss using one command from each category.
From the general command, we can use the end command to exit the shell and commit all changes to the repository. We can use the help command to get help about the commands independent of the category we can use the following syntax.
|
|
|
|
To import he service manifest into the repository if managed to mess the current manifest we can simply use the import command as follow.
|
|
|
|
The entity commands allow us to perform CRUD operations on SMF database. We can get a list of all system services by using
|
|
|
|
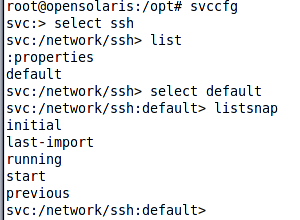
The snapshot commands allow us to list instance snapshots or revert a service instance to its previous snapshots. For example in the following figure we can see how to get list of ssh default instance snapshots.
The instance category only has one command named refresh which perform
the same task that the svcadm refresh
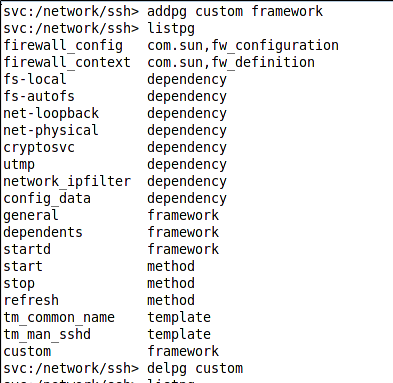
The group property manipulation commands allows us to list, add or remove a property group from the service. For example to add a property named reason and then remove it we can use the following commands.
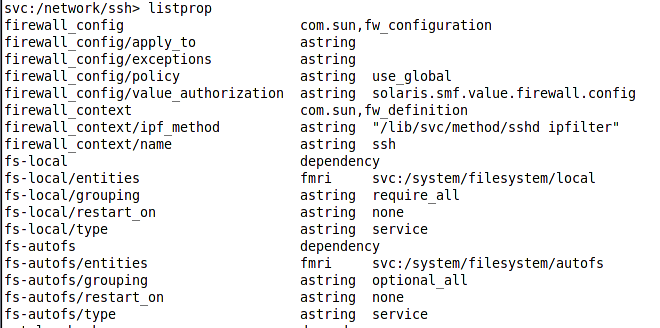
The property commands provide us with CRUD operation over the service properties. For example to list all properties of ssh service default instance command we can invoke listprop commands when we have the ssh service selected.
To add a property we can use addprop command. For example to add a new integer property inside the custom group we can use the following command.
|
|

To update an already existing property we can use the setprop command with the same syntax but we should omit the property type.
Finally we can use the value manipulation commands to change or add a value to a property. For example to change the value of custom/iss we can use the following command.
|
|
How it works…
The svccfg like other service administration commands manipulates the SMF repository to change a service configuration. The SMF repository is a registry where all services configuration (manifests) are stored.
See also
To learn more about serve repository and service management check recipe ## and two previous recipes. The man pages for svcadm are another source of knowledge and understanding for the svccfg shell commands.
9. Using Service Profiles
The service profiles are a concept allowing us to quickly change the OpenSolaris installation from serving one purpose to providing another, for example from serving as a storage server to a Web server or directory server. The default service profile called the generic profile is a multipurpose profile in which all of the basic services are started to make the OS a multipurpose server while we have other service profiles which we can enable on top of the generic profile to quickly tailor the system for other purposes.
Getting ready
We will use the svccfg utility to manage the profiles. So it would be good to review the recipe 5 and 8 before continuing this recipe.
How to do it…
To start using a profile we need the profile description in the format acceptable for the SMF saved as file accessible to the svccfg command. OpenSolaris come bundled with some predefined profiles which are stored in /var/svc/profile directory which is show in the following figure.
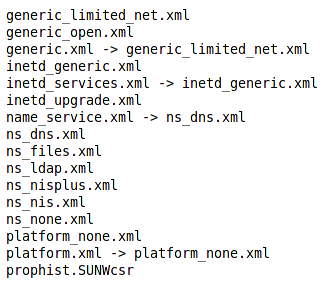
The names are self explanatory and content of each file contains the explanation about the profile purpose. To see content of each file we can simply use cat command or gedit. For example to view the content of the ns_nis.xml we can use one of the following commands.
|
|
|
|
|
|
How it works…
Each of the profiles storage file contain a list of services along with their instances and instance statuses. The status can be enabled or disabled based on what we require the profile to do. The files are well formed XML files conforming to /usr/share/lib/xml/dtd/service_bundle.dtd.1 schema.
See also
Reviewing the recipe 5 and 8 is recommended for learning this recipe more effectively.