Monitoring ZFS pools performance using zpool iostat
Performance, performance, performance; this is what we hear in all software development and management sessions. ZFS provides few utility commands to monitor one or more pools’ performance. You should remember that we used fsstat command to monitor the UFS performance metrics. We can use iostat subcommand of the zpool command to monitor the performance metrics of ZFS pools. The iostat subcommand provides some options and arguments which we can see in its syntax shown below:
|
|
|
|
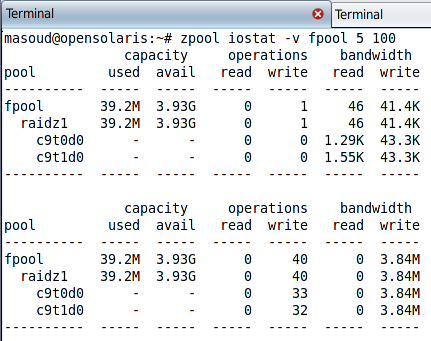
The first row shows the entire pool capacity stats including how much space were used upon the sampling and how much was available. The second row shows how many reads and writes operations performed during the interval time and finally the last column shows the band width used for reading from this pools and writing into the pool.
The zpool iostat retrieve some of its information from the read-only attributes of the requested pools and the system metadata and calculate some other outputs by collecting sample information on each interval.